|
|
|
|
|

|
James LoseyBiographyJames Losey received a Ph.D. from Swinburne University of Technology while researching simulations of vapor-liquid phase behavior of simple fluids as well as water flow simulations of water in carbon nanotubes.
He enjoys long walks on short piers and talking with his grandmother on the phone.
|
|
Research
smFRETFluorescent resonance energy transfer (FRET) is a quantum mechanical process where a fluorescent dye, after being excited by a photon, will donate energy to a nearby acceptor dye. The energy transfer rate is approximately proportional to the distance between the dyes, with small but meaningful contributions from the orientation of the fluroescent dyes. By carefully choosing dyes with emission spectra that do not overlap much, photon detectors tuned to the specific wavelengths of the donor and acceptor can measure how much energy was transferred and infer distance between the dyes. Experimentalists can attach these dye pairs to proteins or other molecules and measure the emitted light to determine the dye distance and molecular structure.FRET experimental methods explore the sturcure and dynamics of single molecules. The results from these experiments are not always easy to interpret. Through the the simulation of single molecule FRET (smFRET) systems, we hope to gain a better understanding of the processes that generate smFRET data, apply this information to smFRET data interpretation, and qualitatively predict potential behavior in future experiments. SARS CoV Spike Protein CorrelationsThe group perfomed similations to compare the dynamic behavior of SARS COV1 and COV2 spike proteins. To analyze the protein simulations, I performed a dynamic network analysis (DNA) of the spike protein trimer for both SARS COV1 and COV2. This analysis calculated the cross correlation between the C-α at each residue along the monomer backbone and identified areas of that protein that move in a concerted manner. The SARS COV1 simulations displayed greater correlations in movement than COV2, which supported other observations in the simulations that initial configurations of COV2 was more stable than COV1. |
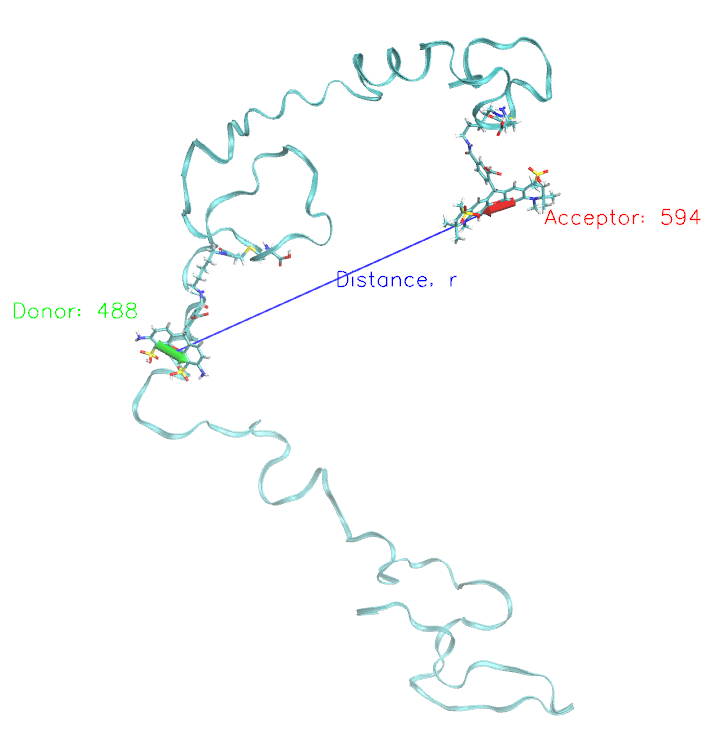
Schematic representation of one simulated conformation of C-Alb3 protein (cyan ribbon) with Alexa 488 and 594 fluorescent dyes attached. The distance between the dyes is shown as well as the orientations of the dyes transition dipole. |
|
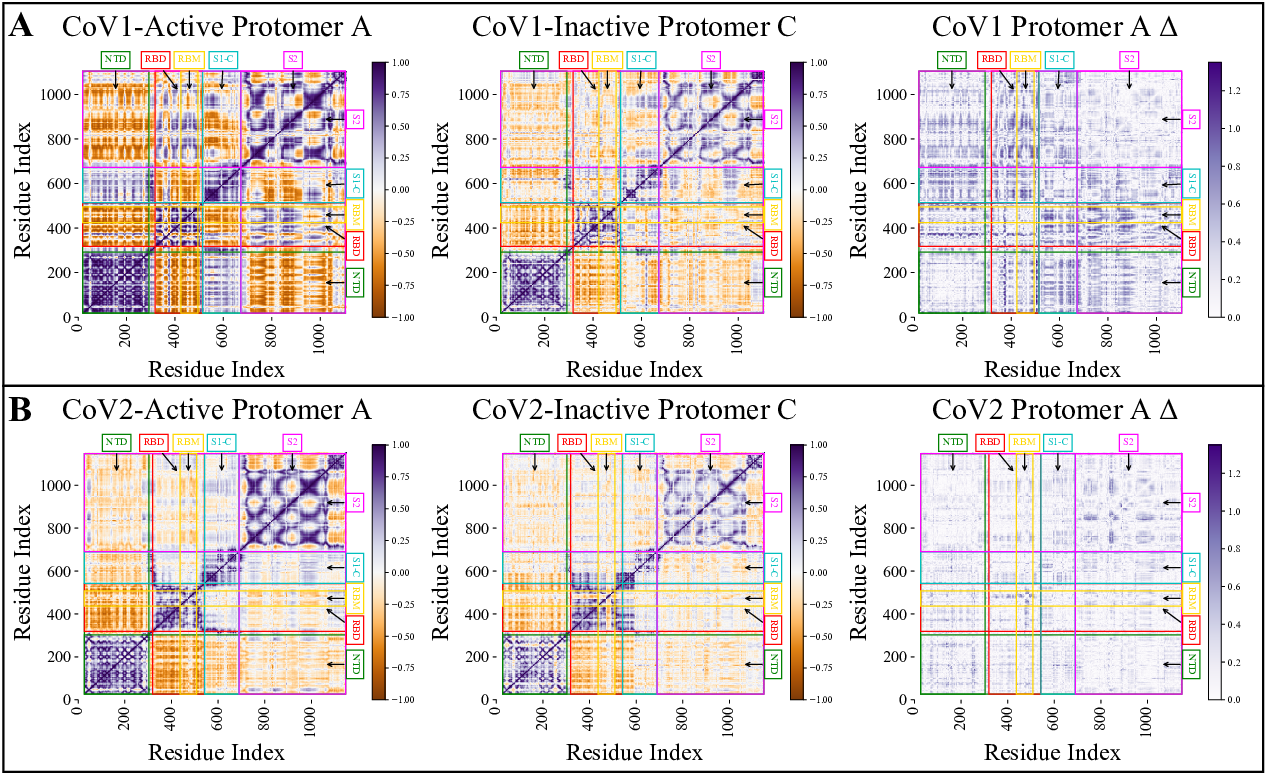
A dynamic network analysis of the active protomer with a reference inactive protomer for CoV1 (A) and COV2 (B) along with the absolute difference between two heatmaps. This figure shows the differences in activity and stability between the two related corona virions. COV1 had much more concerted movements indicating less stability for the active protomer while the active protomer of COV2 was more stable. |
||
|
|